
Big data is the buzz word of the real estate industry right now. Multi-million dollar companies are popping into existence claiming to have the “right formula” for residential valuations - only to a few years later go bankrupt, (like Xiao which claimed to have the special sauce, only to re-brand as Clarocity which claimed the same, only to re-brand back to Xiao when their stock declined 98.5%, Or Housing Canary, or others). Fannie and Freddie claim to have the special sauce in the “Collateral Underwriter” but appraisers nationwide report that the output in all but the most uniform of areas is still just short of gibberish.
At the core of all of these algorithms is math, and much like stock market prediction, the math is complex, unproven and not for the faint of heart. Dr. Jason Osborne of NCSU gives 4 fundamental assumptions that must be true for multiple regression (the system at the core of these systems and most available to appraisers) to be reliable (read his paper here: https://pareonline.net/getvn.asp?v=8&n=2). These four assumptions are:
Homoscedasticity and Variables are normally distributed
This very large word means that the distribution falls evenly around the regression line. These both have to be tested on a case by case basis. However, since appraisers receive no mandatory college level statistical analysis, its too easy for appraisers to trust the tools that they are given that claim to be doing the analysis for them.
Variables are measured without error

At this point, most appraisers are laughing. Appraisers know that the data present in their local MLS has often been “fluffed,” (the word used in the real estate industry for what agents do to make a property look more appealing without outright lying). However, “fluffing” a 2 bedroom home with a windowless den in the basement into a 3 bedroom home is misleading at best. We also know that assessors are not always the most reliable home measures, sometimes including the below grade square footage with the above grade. The data sources that the regression here relies upon cannot be pushed through with out significant cleaning. This is why multiple companies over the last 10 years have been stealing this data from each other, because the raw data is worthless.
A linear relationship between independent and dependent variables
On this point, decades of real estate education again teaches us that regression in real estate fails this test. The “Law of Diminishing Returns,” bluntly states that the relationship of amenities to value is NOT linear, but rather a diminishing curve. Land is the easiest example to showcase because vacant land sales prove it time and time again.
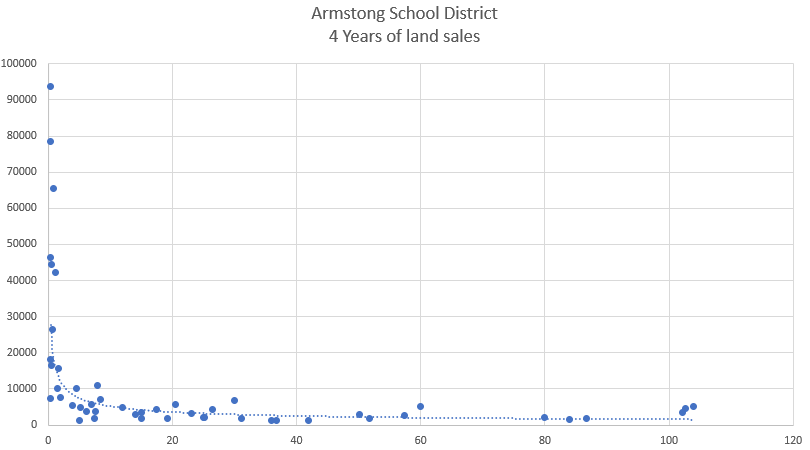
From here we see that the price per acre (vertical) of land decreases as the number of acres (horizontal) increases. This is the “Law of Diminishing Returns” at work. This is true of all of the amenities in real estate (Square footage, bathrooms, pools, etc). As the number of amenities increase, the contribution to the overall value decreases.
However a quick thought experiment is also helpful. Imagine a market in which there are only 3 homes. All are identical, all have identical lots, square footage, bedrooms, quality, and condition. There is only 1 difference between the 3 homes, the number of bathrooms.
House #1 - has no bathroom, at all, anywhere
House #2 - has two full bathrooms
House #3 - has 35 bathrooms
Is the difference per bathroom between House #1 and #2 the same as between house #2 and #3. If you said no, congratulations, you understand the law of diminishing returns and that multiple regression CANNOT be trusted for real estate valuation. If you said yes, please contact me, I have a house to sell you.
In 2017, Town and Country Residential Appraisals reached out to the appraiser community online and asked appraisers to volunteer data from their various areas for us to examine (not to examine their appraisals, only the data that would typically be relied upon for regression). Appraisers from 6 different regions of the country responded. Aside from all 6 data sets failing tests 3 and 4 above, 5 of the 6 data sets additionally showed low levels of confidence in the data that they generated, some offering lower than 10% confidence that the data could be relied upon EVEN IF they had passed all four assumptions above. Please understand, this is not a critique of these appraisers. They delivered to us data that would be used in multi-linear regression. We performed no review of their appraisals or their interpretation of the data delivered (or if they use it at all).
Appraisers can not be complicit in handing over valuation to big data. This has already done damage to the American people and economy, and will only continue to.
There is so much more to say on this subject ie. the importance of P and R squared values, sample sizes, confidence intervals, outliers, etc. However for more reading on this subject, please refer to the following for a primer on these subjects and why linear regression isn’t everything: http://resources.esri.com/help/9.3/arcgisengine/java/GP_ToolRef/Spatial_Statistics_toolbox/regression_analysis_basics.htm
In answer to common responses:
“I only use the data when it gives a logical result.” - This is called confirmation bias. If the confidence interval is low, but the data rendered “makes sense” to you, all you have done is confirmed your own opinion with data that is less accurate than a coin flip in determining contribution (500% less accurate in the case of confidence intervals below 10%.)
“R Squared values / Sample sizes don’t matter.” - I genuinely want to meet the person teaching people this, as I’ve heard it spouted enough with confidence that someone claiming mathematical competence must be teaching it. Simply, yes they do. I have yet to meet someone who can articulate a mathematical defense of this position, however I think they have the following assumption - “Since we have 100% of the sales data for an area, we have 100% of the sample and therefore, R-squared becomes obsolete.” 1) Unless you are also including all off market sales, not even that statement is correct. 2) ML Regression is not claiming to predict amenity contribution of only sold homes in a market but rather ALL homes, of which, typically, only small percentages sell, meaning that we very much need to consider the R-squared value and its effects on homoscedasticity and normalcy of distribution (tests 1 and 2 above) as well as the sample size and corresponding P value.