Get an appraisal BEFORE your subdivision.

041d5f431caf3c6a8fff3c06e4128418w-c339190xd-w685_h860_q80.jpg

I’m a fan of thought experiments (as anyone who reads this page regularly already knows). A thought experiment is a process by which one weighs the information that one has and considers the consequences. Doing this allows the experimenter the ability to make better choices and consider the underlying truths of a situation. Today we’ll apply this to the common practice of subdividing land and discover why it may be helpful (from a value perspective) to have an appraisal beforehand.

Imagine a 50-acre farm, with multiple farm buildings and a farmhouse at its center. The property has rolling hills and is generally a lovely place. However, the landowner, upon their death leaves the land to two sons. Both sons have no interest in keeping the whole farm, however, the younger one does want the house. A neighboring farmer has expressed interest in the property for the purposes of the land only. Perfect! There are buyers for the whole property, all that needs to be done is a subdivision, but where do we draw the lines?

  1. The farmer only wants the land. He doesn’t want the two barns on the property, because he has his own buildings and doesn’t want the liability.

  2. The younger brother only wants the house and no buildings.

  3. The older brother wants the value of both to be as high as possible in order to maximize his inheritance.

Immediately we know that there is going to have to be a compromise. If the farmer has his way, he will own a doughnut-shaped property with the house and buildings in the center owned by the younger brother. Assuming that the house and buildings can sit on only 5 acres, this will leave 45 acres worth of buildings sitting on a 5-acre parcel. Think of it another way: If I have 50 acres of land, and buildings for storing the equipment needed to farm, store, tend, etc that land… what am I going to do with those massive buildings once I no longer need all of that equipment? If the subdivision happens in this way, the “functional utility” (or usefulness) of the barns drops dramatically. In terms of the appraisal problem here:

  1. The farmer and the younger brother do not have the “Highest and Best Use” of the property in mind. They want the property cheep, and for their own purposes.

  2. Only the older brother in this instance has the highest and best use in mind. In order to maximize the property’s value, it might be necessary to subdivide the property in accordance with the brother’s wish, to preserve the value of the barns and other buildings. It might also be necessary to wait and sell to another party that wants the whole property as is.

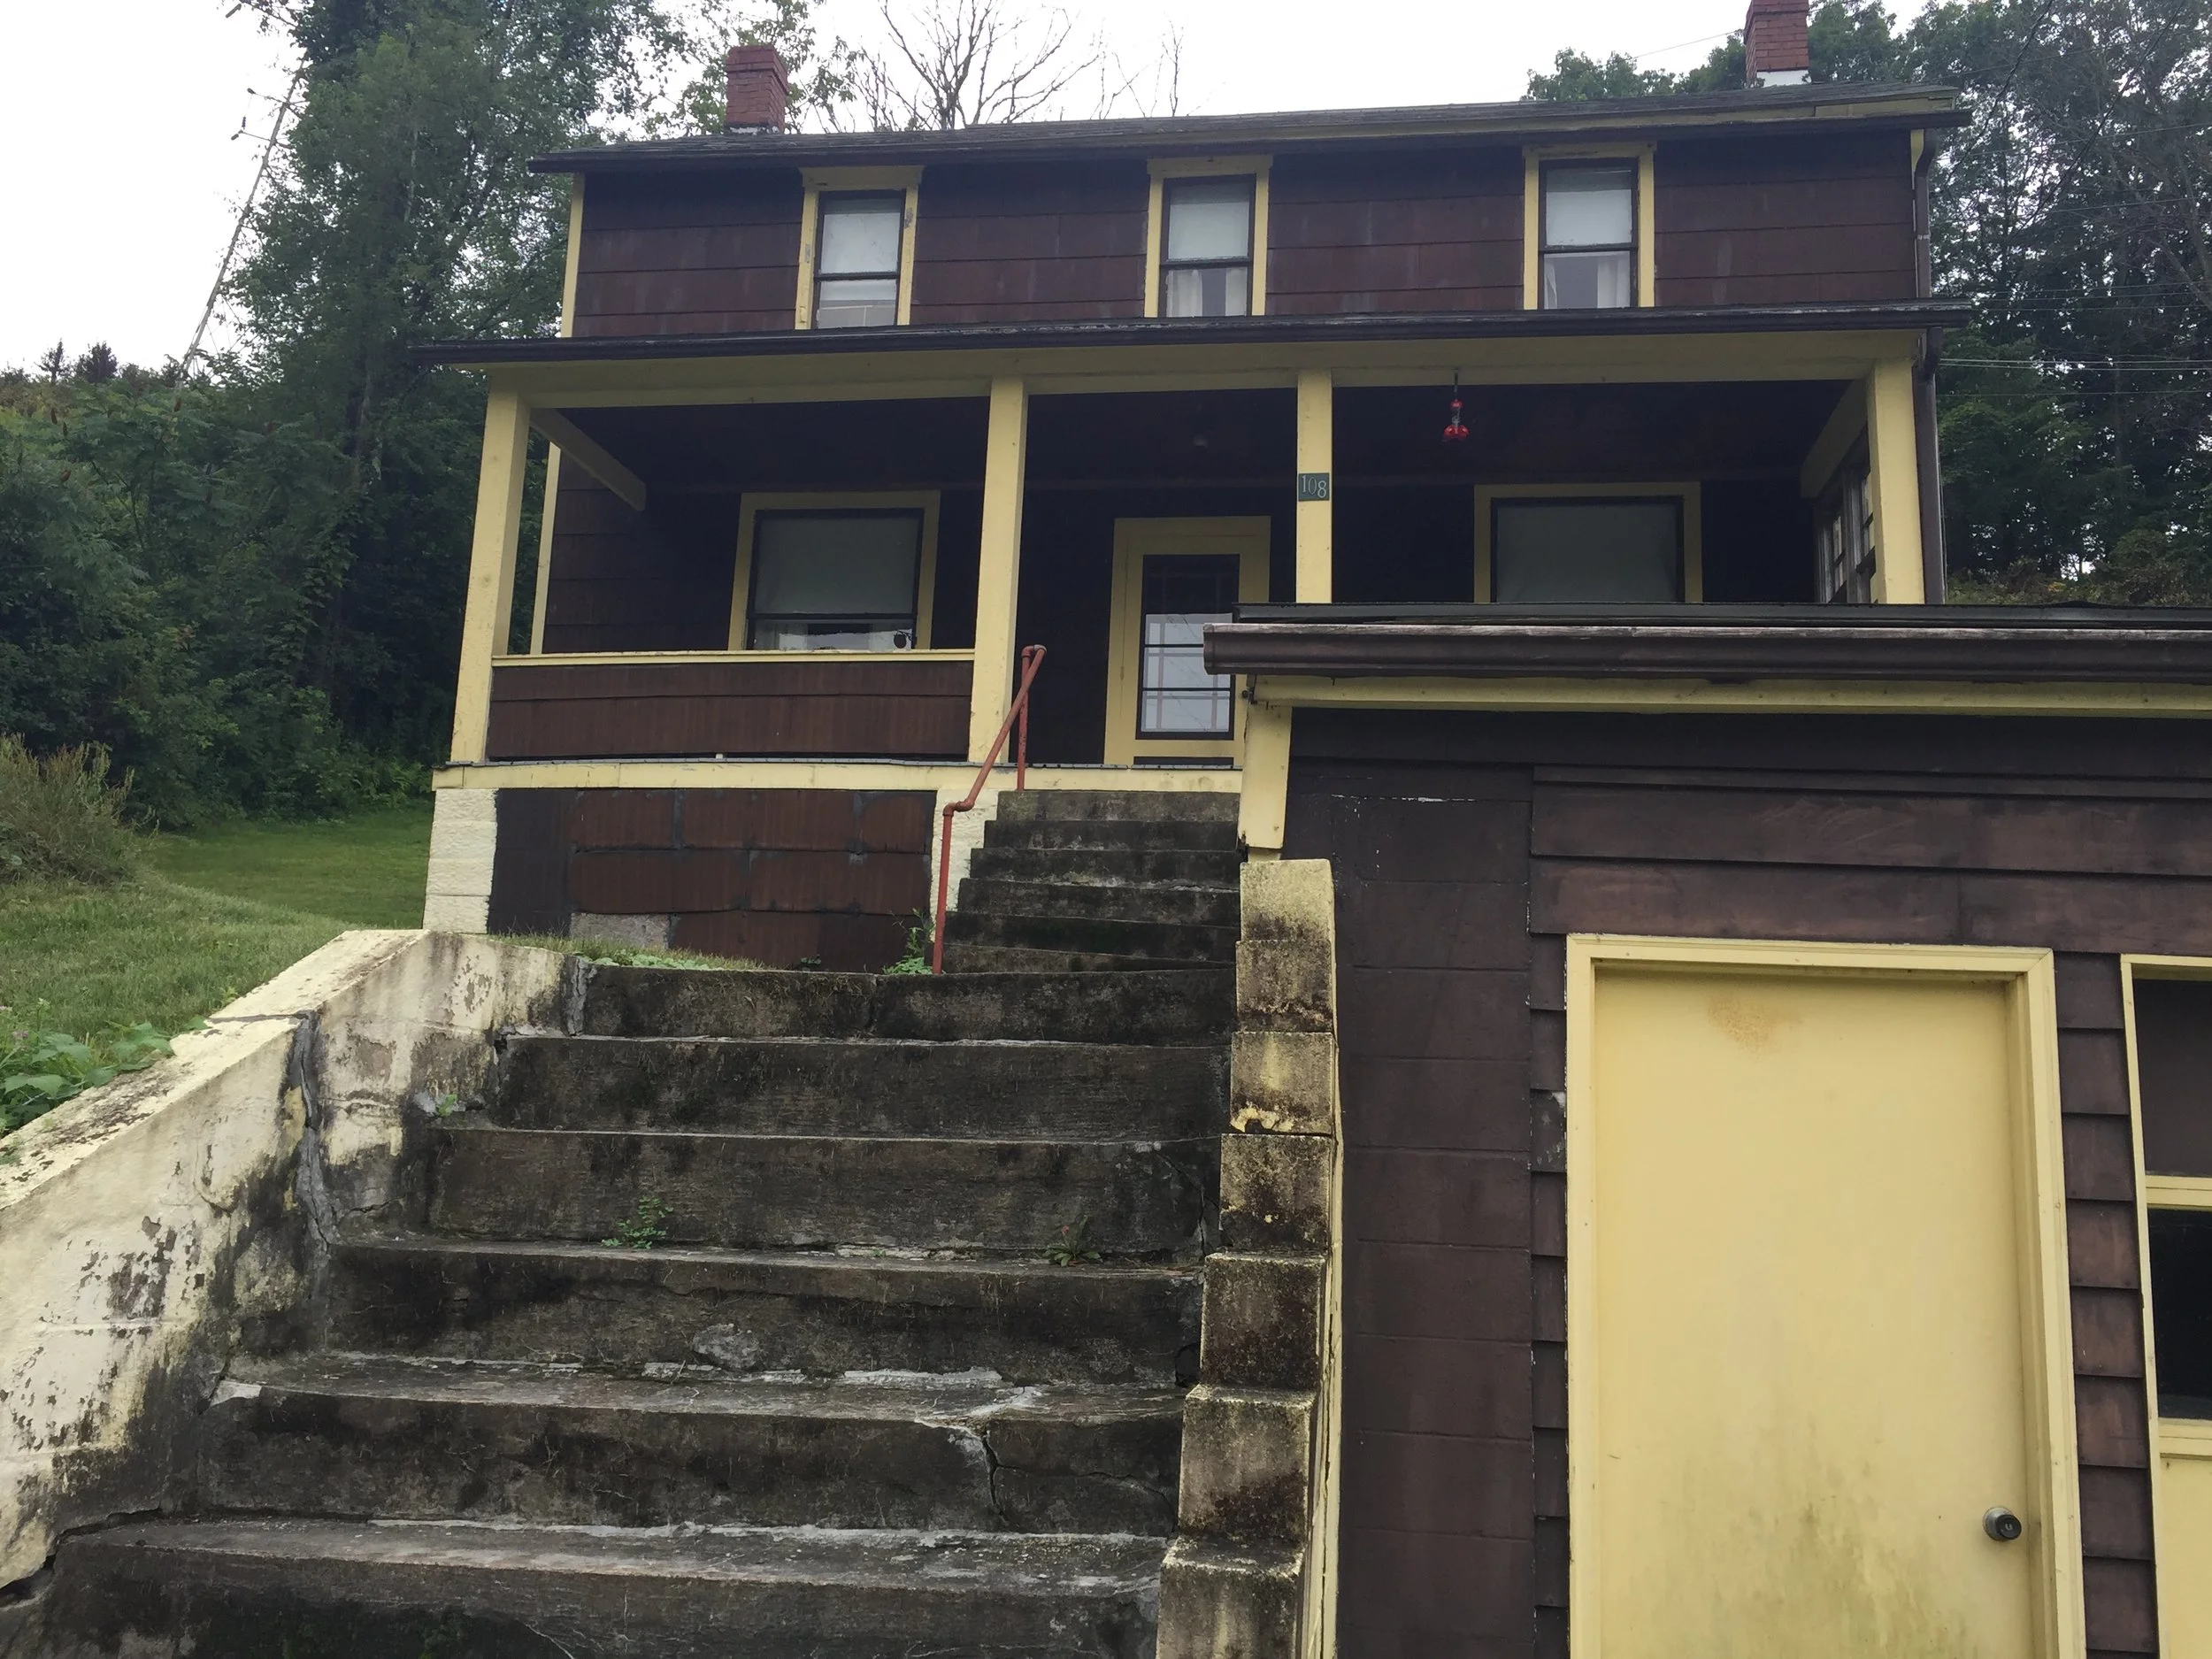
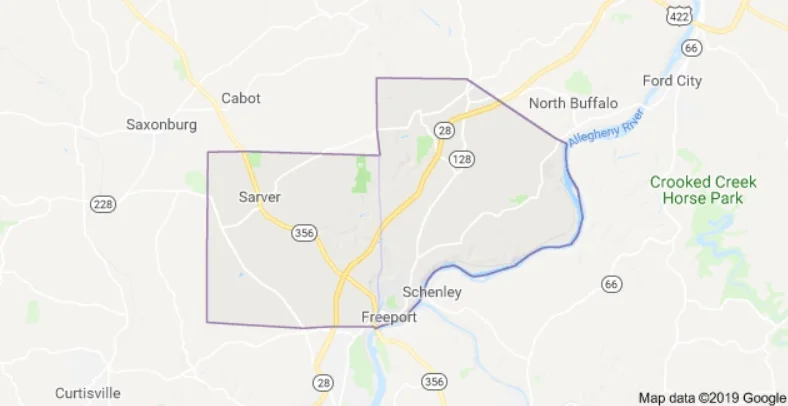
Luckily for us, in rural western PA, we have the case study of what happens when this type of situation occurs.

edited subdivision on Freeport Rd.JPG

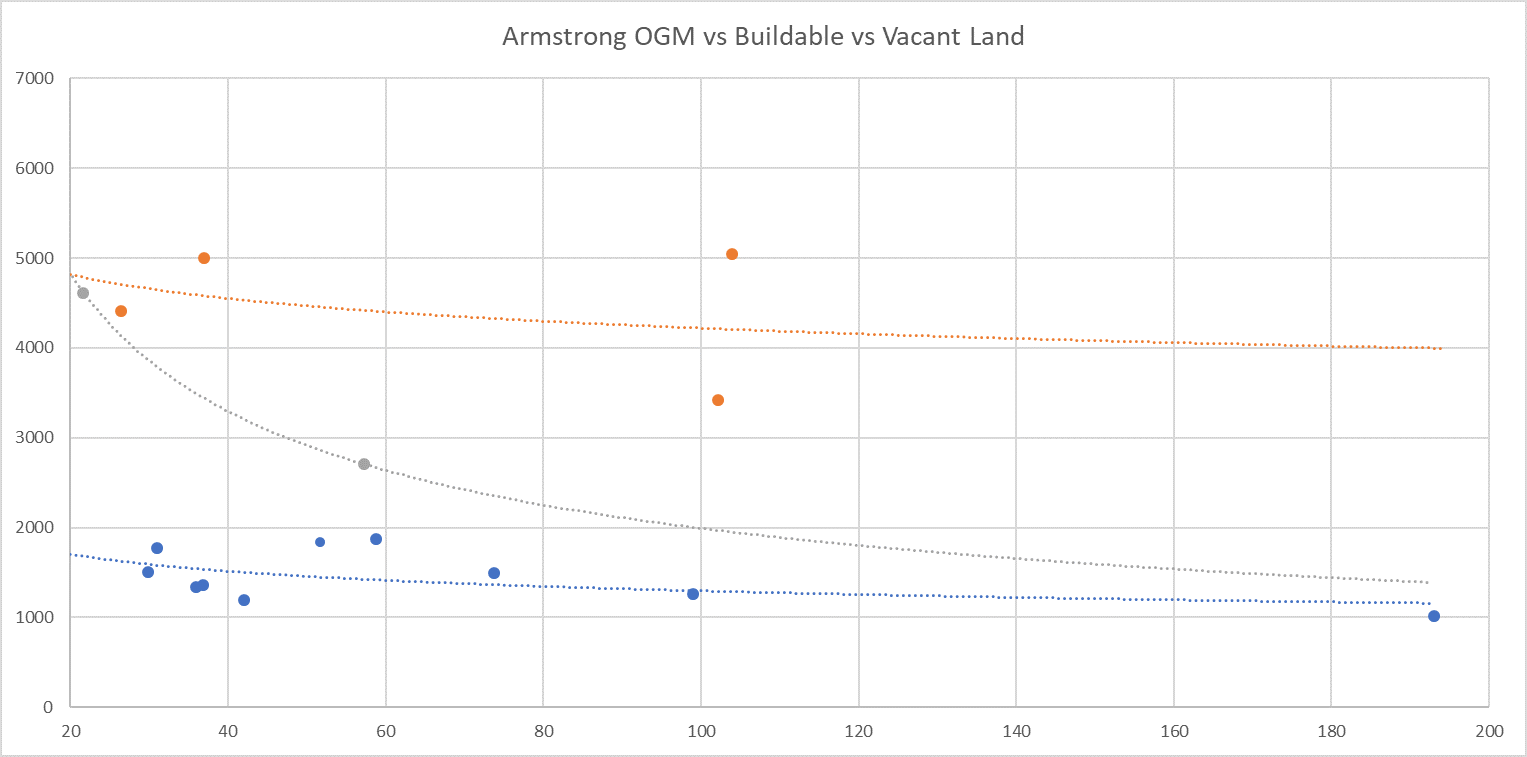
What you see here is a 48.66-acre farm that was subdivided, with a 5-acre parcel removed from the middle. All of the farm’s improvements are on the 5-acre parcel, and there is little room for a hobby sized vegetable garden on the remaining land, much less a farm that would need two large barns with areas for livestock plus other buildings. When this subdivision was made, the usefulness of the outbuildings on the 5 acres of land went to nearly 0. Unless the highest and best use of a commercial venue (rustic farm weddings perhaps) is envisioned, it’s hard to imagine the typical buyer seeing these buildings as anything more than a liability.

How could this be corrected?

  1. The owner of the home could seek to sell the buildings to the farmer of the other land.

  2. The owner of the home could purchase the farmland back, thus restoring the utility of the outbuildings of their site.

If you find yourself in need of a subdivision, a surveyor can give you the options as to where property lines could be placed. You do need to consult with a valuation expert to determine the highest and best use of the property, the potential buyer pool of the property and what characteristics (site size, improvements, etc) that they expect. Once you have all this information, you will be best prepared to create a subdivision that not only serves the needs of each parcel being created, but gives you the highest and best use resulting in optimum value.

To demonstrate an example where there is plenty of information, go to: https://en.wikipedia.org/wiki/Klondike_Big_Inch_Land_Promotion

This was one of the strangest “subdivisions” of all time. In 1955 Quaker oats bought 19.11 acres of Yukon territory, and printed 21 million deeds of 1 square inch of land to give away with their oatmeal. They paid $1,000 for the whole 19.11 acres - but how much were 21 million square inches worth separately? Well, in as much as the entire parcel was reclaimed by Canada for failure to pay $37.20 in back taxes, its fair to say that it was probably made worthless. To put it another way, poor planning of a subdivision destroyed 100% of the value of the land.

NEVER refinance your home this way!

GettyImages-905715568-165b35e0077e499daf2dc4244770f019.jpg

In the lending/appraisal world there is something called a “Drive-by” or “exterior only” appraisal. These are performed on a 2055 FNMA form and have a scope of work that is limited to an inspection “from the street” only. According to the scope of work, the appraiser then assumes that the interior is consistent with the exterior of the home (in condition and quality).

There are times where these are needed - pre-foreclosure is the most common need. The bank can’t gain access to the home, but needs to know the value of the home to make financial decisions.

REFINANCE, much less a FULL REFINANCE should NEVER be performed based on an exterior-only report. You are asking to go under water if you allow your bank to do this to save $100.

We can not say this strongly enough. Please, ask your bank what kind of appraisal they are ordering, and demand a full appraisal to save yourself thousands. We ran across a case recently that illustrates the dangers of using the wrong type of appraisal:

  1. In 2016 we performed an exterior-only appraisal for a lender. The home had been fully updated on the exterior. We were asked to not contact the homeowner in the engagement letter. Therefore we complied with the required scope of work and appraised the home under the hypothetical condition that the interior matched the exterior. The final opinion of value was $105,000.

  2. The bank then made a loan on the property based on a 90% loan to value ratio: $94,500.

  3. Now in 2019, we were asked to perform a full appraisal on the home. The exterior is still in very good shape… but stepping through the front door is a journey back in time. Well maintained, but nothing updated since the 1970s. The value of the home now: $85,000. After three years of mortgage payments, the homeowner is now $3,000 in the hole.

How did this happen, did we perform a bad report? We immediately double-checked our work and found that the report was a credible appraisal of what we were asked to appraise. However, the lender should NEVER have been allowed to write that loan based on that appraisal (that’s a FNMA, federal lending regulations issue).

We close this blog with a warning from the past about the cost of liberty. We might insert the phrase “financial liberty,” here to emphasize our point. The borrower must educate themselves about the loan process in order to not be taken advantage of by those whose financial interest is not concerned in the slightest with their own. We write these blogs for anyone involved in real estate in hopes that a more educated populace with lead to a more financially free populace.

wendell-phillips-724654.jpg

What is a "Comp?"

Imagine home valuation in this neighborhood. Every house identical… except for the ones next to the industrial site.

Imagine home valuation in this neighborhood. Every house identical… except for the ones next to the industrial site.

As a VA Panel appraiser, we have access to something called “Tidewater” on VA orders. This allows us to reach out to the lender and ask for what the agent used to assist their client in pricing/making an offer on the home in question (most lenders discourage this in any other transaction). This means that over the years we have received properties from real estate agents on properties where we had a question as to the rationale used to develop a contract price.

Sometimes the properties we get are great comparables, already in our search or overlooked somehow, and immediately included in the report. Sometimes they aren’t “comps” at all. So what is a “Comp?”

A “Comparable Property” is: “Able to be compared to the subject property”

  1. A property that the buyer pool would likely also have considered in their search

    • For standard homes, comps are all similar in nearly every area (location, condition, size, lot size, etc) and this makes the analysis far simpler.

    • For unique homes, comps may only be very similar in one area, and a wide group of comps is used to bracket all of the various features (if the home is a 3,000 sqft 1 bedroom home, you may have a 3000 sqft 2 bedroom, and a 1500 sqft 1 bedroom as comps to bracket both features because the subject is very unique in this combination of features).

  2. A recent sale. Most lenders have a default desire for sales within 90 days. However, in rural areas, this is likely to be impossible. Sometimes the most recent comparable property sold 2 years ago. In which case more recent sales that are less comparable will be included and adjusted, but the dated comparable will also be included to help develop the opinion of value.

A “Comparable Property” isn’t:

  1. A listing. Listings can be helpful for agents in pricing a property, but they only tell half the story. They tell, “How much do sellers want,” but not the other half of the story, “how much are buyers willing to pay.” Listings may give some information, but sometimes they are deceptive. Over the course of the past 3 years as Indiana County sale prices declined, for 2 years listing prices were increasing.

  2. Always a sale that is close in price to the subject contract. Sometimes we get a list of properties that are right at/near the contract price… but they’re all in superior condition, size, acreage, etc. That means that they support a lower value for the subject. Because, no two homes are the same, true comparables are a little better and a little worse than the subject in various factors.

  3. An average of local sales. We had this provided once, and in the agent’s defense, it was a very hard market to appraise in. Taking an average of the local market and giving it with a list of local sales to the appraiser is not “comps.”

If you’re going to provide comparables to an appraiser make sure they are comparable.

For more quidance on comparable selection:

http://www.workingre.com/three-dangerous-ways-choose-comps/

https://sacramentoappraisalblog.com/2014/10/30/how-to-pull-comps-like-an-appraiser/

https://birminghamappraisalblog.com/appraisal/what-does-the-appraiser-do-when-there-are-no-comps/

"Latent Fire Hazard"- Federal Pacific Stab lok Breakers

FPE.jpg

If this looks familiar, contact an electrician today.

Sadly, after 4 decades of warnings, proof that Federal Pacific falsified their testing data for UL, and testing that shows 1 in 3 Stab-Lok breakers are defective, we still find homes that are serviced by these breakers. Between 1950 and 1980 Federal Pacific sold millions of these breakers that were installed nationwide. Sadly, the USCPSC found that it would be too costly to recall these breakers in 1983. An estimated 2,800 fires, 13 deaths and $40,000,000 in property damage are caused per year.

In our years of appraising, we have asked many firemen and electricians about these breakers. Most firemen use a series of expletives in regards to them, followed by “replace them immediately.” Electricians have a similar reaction. Theoretically, if an electrician were to certify that the panel is safe, it would not need to be replaced, however, in nearly 20 years we have never met an electrician willing to take on that risk.

This is not a risk that anyone is willing to certify as “safe” and not one that homeowners should live with. For your safety and the safety of your household, have these panels replaced immediately.

For more information:

https://www.homeinspector.org/HomeInspectionNews/despite-previous-safety-concerns-this-circuit-breaker-is-still-in-homes.5-9-2018.2154/Details/Story

https://blog.societyinsurance.com/why-you-should-replace-federal-pacific-stab-lok-panels/

http://www.startribune.com/fpe-stab-lok-electric-panels-don-t-need-to-be-inspected-they-need-to-be-replaced/131912743/?refresh=true

How much is an acre worth?

8ecb8b5c10a19ccbe1daba7bc38ec77cw-c319826xd-w685_h860_q80.jpg

We get this question a lot: How much is an acre of land worth in [Location], and like so many things in real estate, it depends. For purposes of this blog lets perform a thought experiment with the following property.

91335.jpg

Here we see a 67-acre parcel of land in Athlone, Ireland, but for our purposes, lets set that aside. This single parcel has 1) Road frontage on what appears to be a major roadway, 2) River frontage in the top right, 3) What appears to be agricultural land in much of the center, 4) and lets assume for this case that the dark area in the upper left is an industrial site.

So, what is an acre of land worth in this parcel? Clearly there could be many answers, but this begins to get our mind to ask the right questions.

What is the Highest and Best Use - There are 4 tests that a property should pass in order to determine the market value of that property.

Physically Possible - What can physically be done with the property? Obviously placing a Boat Marina on the road frontage area is not physically possible, but perhaps it is on the river.

Legally Permissible - If I build a home on the riverfront, only to find out that the law prohibits building in that area due to flooding, then I will have wasted a great deal of time and money.

Financial Feasible - Perhaps its possible and permissible to build a home on the riverfront, but the soil there requires such extreme needs in terms of foundational work that the resulting home that one would build would cost too much for anyone in the market to purchase.

Most Profitable - If given a choice between equally possible, permissible and feasible plans, which would create the greatest value? For example, should the 67 acres be one single-family dwelling lot or 67 1-acre lots for a subdivision? Lot values for the second will very likely be much higher than the first, and this may be the better case.

All of these factors will affect the buyer pool, which will ultimately set the market value. Individuals looking for hunting land pay less than farmers looking for cleared land, and these pay less than land developers. Why? Because there is more profit to be had as we go up through those buyers’ interests.

Within those four questions, the following items are given consideration

What are the External Factors - is the site located next to an industrial site, near a nuclear power plant, near a paper mill - then expect that the land will demand a lower price.

What are the Internal Factors - is the property cleared and level, or a cliffside of giant boulders?

Land valuation may seem simple, until all of the factors that affect the market value of land are considered. Here is a graph of vacant land sales in Armstrong County and an analysis of 3 primary factors.

armstrong ogm.png

Above we see three types of vacant land transfers graphed on a price/acre per acre basis. Orange - vacant land that transferred with Oil, Gas and Mineral rights. Grey - vacant land that was suitable building sites. Blue - Vacant land that was not a suitable building site at the time of transfer (either the property was heavily wooded, the topography would prohibit it, etc). Here are some takeaways:

  1. We see the law of diminishing returns at work in all three: The more of something that you have, the less each additional piece is worth.

  2. The vacant land with OGM rights intact is very similar to the shape of the graph of those without OGM rights. The difference can in fact help in the process of extracting the value of the right to extract oil, gas, and minerals from a property (which is very different from the valuation of the oil, gas and minerals themselves). Appraisers do not value OGM rights in appraisals for lending purposes. This is because banks do not place a lien against those rights typically. In other words, if the land is purchased as well as the OGM rights, the OGM rights can be sold off separately from the land itself.

  3. Buildable lots have a more steep decline. Most buildable lots in Armstrong county are of the 5-10 acre variety, and very few are buying 100 acre lots to build their new home. As a result, there is a higher demand for lower acreage building lots, and therefore a higher price per acre.

So, how much is an acre worth? It depends, on a lot.

Lead Based Paint

The classic cracking/scaling pattern of lead based paint. If you see this, there is a high likelihood that your home/structure has lead based paint.

The classic cracking/scaling pattern of lead based paint. If you see this, there is a high likelihood that your home/structure has lead based paint.

Since the ongoing crisis in the Flint Michigan water supply, lead has been in the news nationwide. Lead is one of the most destructive substances to childhood development as it attacks the brain and central nervous system, and at highest levels can cause coma, convulsions, and death.

At lower levels of exposure that cause no obvious symptoms lead is now known to produce a spectrum of injury across multiple body systems. In particular lead can affect children’s brain development resulting in reduced intelligence quotient (IQ), behavioural changes such as reduced attention span and increased antisocial behavior, and reduced educational attainment. Lead exposure also causes anaemia, hypertension, renal impairment, immunotoxicity and toxicity to the reproductive organs. The neurological and behavioural effects of lead are believed to be irreversible.
— World Health Organization

With such horrifying effects, it is no wonder why the FHA / USDA and VA will not underwrite a loan unless Lead Based paint is properly treated. Today we will tackle some in-home investigating and treatments that you can perform to keep your family safe:

Investigating Lead Paint - excerpts taken from House Logic

The EPA has recognized the following in-home tests for discovering if your home has lead paint present:

For wood and metal surfaces: https://leadpaintepasupplies.com/lead-test-kits/

For wood, metal, drywall and plaster surfaces: https://www.esca-tech.com/ProductDetail.php?category=2700&productnum=LPTK

These tests work in a similar fashion, in which a swab of the surface is taken and a chemical reaction takes place in the presence of lead in order to reveal a color indicator.

Please note: While these tests may give you peace of mind, they will not suffice to exclude your home from needing larger remediation in the case of FHA/USDA/VA financing for a loan. The level of testing that would be required by federal guidelines is usually far higher than the cost to encapsulate any supposed lead paint.

IMG_0432.jpg

Remediating Suspected Lead Based Paint

HUD/EPA’s policy infers that there is a high likelihood that any home built prior to 1978 has had lead-based paint at some point, and so all homes built before this date MUST have all chipping and peeling paint remediated by the following methods:

  1. The surface must be scraped to remove all loose and peeling paint. Those chips can not be left on the ground however, as this is a risk to the ground and water being contaminated with lead.

  2. The surface must then be painted to encapsulate the remaining surface.

Dust is the primary means that lead can enter the body, so this process should be performed carefully. HUD provides extensive guidelines for the entire process, available here.

Information

https://www.who.int/news-room/fact-sheets/detail/lead-poisoning-and-health

https://www.hud.gov/program_offices/healthy_homes/healthyhomes/lead

https://www.epa.gov/lead/protect-your-family-exposures-lead

https://www.webmd.com/women/lead-paint#1

Treatment

https://www.health.ny.gov/environmental/lead/renovation_repair_painting/encapsulants.htm

Market Data Analysis: Declining Markets

decline.jpg

Telling someone that their house has lost value won’t make many friends, but it will distinguish you as a real estate professional if you can analyze a market and be honest. The national news has talked about housing prices increasing yearly for nearly a decade now, and some areas of greater Pittsburgh has matched those trends at some times, others have remained flat, and others have declined. Today we look at some declining markets, and how to use simple tools to visually determine if there is a decline, and at what rate.

The above is the national median sales price trend since 1990 vs. the builder cost trend. We can see the slow down in real estate around 1990, the decline of 2008 some possible trends emerging now. However, the first thing that we should note is tha…

The above is the national median sales price trend since 1990 vs. the builder cost trend. We can see the slow down in real estate around 1990, the decline of 2008 some possible trends emerging now. However, the first thing that we should note is that VERY FEW areas in the greater Pittsburgh area have seen increases this aggressive. SO, before any seller says, “I bought my house 3 years ago, and houses have gone up nationwide by 3% per year… so my house is worth 9% more?”

The above are homes that are from across Indiana County that are of a higher quality construction. This is not merely a limit of, for example $200,000 and above (limiting a data search by a hard number like that will skew the results of the analysis…

The above are homes that are from across Indiana County that are of a higher quality construction. This is not merely a limit of, for example $200,000 and above (limiting a data search by a hard number like that will skew the results of the analysis). In appraisal language, these properties are all Q2-3 homes (For the definition: http://www.bradfordsoftware.com/uad/UAD_Glossary.pdf)).

Over the last 3 years (after a reassessment in Indiana County that sparked a spike in selling, and reduction in property values) the above data points represent the higher quality sales across the county. Once selected, these sales (with sale date, sale price, and original sales price) were placed in an Excel Spreadsheet. The data points were then graphed and a trend line calculated for each using the tools within Excel. We observe a few things above:

  1. There is a clear convergence of the scatter plot around a downward trend (with the exception of a few recent sales. Those two sales were some of the largest properties in the analysis, and one of them sold 23% below the original list price and stayed on the market for 2 years).

  2. The trend line indicates a median decline of $19.45 per day. When calculated with the median sales price of $325,500 this comes out to an annual decline of 2.18% per year among these homes. This is then a starting point from which we can refine the decline - however, this is a great starting point from which to make sure we’re taking a possible declining market into consideration.

  3. From other analysis of Indiana County as a whole, we’ve seen that some of the hardest-hit areas “may” be finding a bottom. There is the possibility that those recent high sales will result in a similar possible turn OR those recent lower sales would indicate that the decline continues. In six months, we’ll know for sure what is happening right now.

That is perhaps the most frustrating part of market analysis. Its always rear looking. While our “gut” might tell us that the market is “hot,” data is needed to be a professional. Look at the above graph one last time. The original list price trend is falling at 3.98%, 180% faster than sales prices. Why? Because sellers and their agents were way off 3 years ago, and are only recently starting to get to close to realistic sales prices. Our gut is susceptible to “confirmation bias,” in this case, the desire to see a stronger market than what really exists.

Do yourself a favor,

  1. Run the data on your market areas on at least an annual basis to stay on top of what the markets are really doing.

  2. Read our county reports that we distribute throughout the year for wider trends.

  3. Stay abreast of the national market data, but don’t put too much weight on it.

CMA Toolkit: Test your list price.

ComplianceSuccessToolkit-illustration-01.jpg

When preparing your CMA, one of the best steps you can take is to test your list price. The process is pretty simple but easy to skip. Let’s go through the basics of a great CMA.

  1. Look at the history of the market area of your property. This will give you an idea of the high-low range that the area can handle. Three years is a good time-frame to look at.

  2. Narrow in on properties characteristics like yours. Now that you have the broad range, begin to narrow in on property characteristics that matter. If your property is a 4 bedroom home, eliminate the 2 bedroom sales. If your property has 1 bathroom, throw out everything above 2 baths. If your property has been recently updated, throw out the REO. Now you have a much smaller indicated range.

  3. Get picky. Now that you’ve trimmed from possibly 100’s down to 20, select those 3-5 properties most like yours. This will give you a much tighter range within which to advise your buyer/seller.

  4. Test your price. The steps so far should get you in the ballpark, but “confirmation bias” can be sneaky. Its time to see if you were truly objective. Take the price that you’ve come to and do a search in your market area of a (for starters, it may need to be tighter or wider) 10% plus/minus. Start looking at your property list and ask yourself the question, if I had $(Price) to spend, would I buy the house I’m looking at or this house.

    In appraiser speak, this is called sensitivity analysis: The ability to look at two things and determine which is superior. As you move through the list of properties you should find the space where your property falls, the sweet spot, and that should inform the price that you place on the property.

    If cheaper homes are better than yours - your price is too high. If higher-priced homes aren’t as nice as yours - your price is too low.

Home valuation is tough - that’s why appraisers have 300 hours of education and 1500 hours of experience before they can sit for their license. If you ever need advice, don’t hesitate to call. We also offer in-office training for free for real estate agents on a variety of real estate topics, including FHA/USDA/VA financing, CMA preparation, and others.

Data Coop: Can it be trusted?

WOW… look at all that information. Surely, there is something useful in there!

WOW… look at all that information. Surely, there is something useful in there!

Summary Opinion: Data Coop is like drinking from a firehose… you will be all wet, but not very satisfied. There is a ton of data, and some of it could be useful sometime, but relying on that data “as-is” for anything close to credible would be foolhardy.

The West Penn Multi List has brought CoreLogic’s “Data Coop” live this week. So lets take it for a spin. A look at 5001 Pioneer Court (an active listing) above gives us basic information available in the typical MLS sheet, but then expands that information to other publicly available info.

When we pull up the “Neighborhood report",” we get some statistics for the Murrysville mailing address, and at first this appears that it would be a useful tool to hand to a prospective buyer, but then we get the following:

wrong sd.PNG

These are the three nearest schools to this property… however, none of them are in the subject property’s school district, or even in the same county. This is immediately concerning because if this information were to be relied upon to inform a buyer, we could be liable for misinformation.

As we go further into the report, we find that the Data Coop offers an AVM (Automated Valuation Model).

avm.PNG

Here we are given a list of 5 properties, all from Franklin Regional SD, with a range of sales prices from $258,000 - $325,000, and four of those properties being in the same plan being being $273,000, $315,000, $320,000 and $325,000. So, where does the AVM come in… $362,000? It seems that the AVM is placing greatest weight on the current listing price, which would be $40,000 higher than the highest sale in the last 3 years. We’ve performed this same kind of analysis in more difficult areas to appraise, and in addition to crossing county lines, the AVM also crosses school district lines. These practices are typically only performed in the case of highly unique homes and require a great deal of analysis.

These are truly troubling. There is a lot of information here, but there doesn’t appear to be any rhyme or reason to it. This is important because CoreLogic claims to be the foremost leader in home valuation technology. Their data is actively used by government organizations, but appraisers regularly report that the information that they are deriving their data from is flawed, and the analysis they are performing is deeply flawed.

I'm sorry Chip and Joanna Gaines lied to you.

gaines-fixer-upper-tdy-home-tease-ae_0e0546dc425ece945d17a1c4aeaffb1a.jpg

We love Chip and Joanna Gaines - they’re cute, spunky, hard working folks. They’re an adorable couple, but sometimes we cringe at the real estate statements that come out of their mouths - and they are some of the better ones on HGTV. Chip and Joanna claim to “take the worst house in the best neighborhood, and turn it into our clients dream home,” and on its face, this sounds pretty good. In home valuation language they are trying to buy under improvements for the neighborhood, which are usually a good deal, and below market value, but then there is the second half. A “dream home'“ is often code for “over improvement for the neighborhood,” and typically see lower market values compared to their costs. With that said, lets look at some of the half truths and hidden land mines that you want to avoid if you’re following Chip and Joanna’s example.

  1. “Fixer-uppers” don’t usually qualify for financing.

    Its a rude awakening when you find your dream “fixer upper,” place your offer and then the bank comes back and informs you that the condition of the home won’t qualify for your loan. Lenders have minimum property requirements that a home must meet in order to secure financing. The short thing to remember here is: Is the home 1) Safe - are there obvious safety concerns that endanger inhabitants of the home, 2) Structurally Sound - is the home going to stick around for 30 years, or does it need a major structural overhaul, and 3) Can the property qualify for the particular type of loan you need (chipping and peeling paint will hold up a FHA/USDA/VA loan, etc). There are loans that can be used for fixer-uppers, but you need to know to ask for them: FHA 203k / FNMA/VA Renovation loans. These loans allow you to obtain quotes from contractors and take out a loan for the final total cost versus the final market value of the home once renovated.

  2. Cost does not equal value.

    “I’m going to buy a $20,000 home in a $30,000 neighborhood and put $50,000 into it! So, Chip and Joanna taught me that will add $50,000-$100,000 dollars, right?!

    No. That’s not how any of this works.

    You’ve priced your property out of the market, and unless a very foolish person comes in with $100,000 cash, you’ve probably thrown away nearly $40,000. The mantra that every renovator needs to memorize is “Cost does not equal value.” Its a simple and silly illustration, but it works: how much does a fourth full size pool add to value. Anyone can see that cost doesn’t equal value in this case, but it holds true across the board. In any renovation, you must keep in mind a few things to see the largest return on your investment:

    1. What is the high end of our market?

      This should help you set your maximum budget. If you bought your home for $50,000 and the highest sale in the last 3 years was $70,000, spending anything more than $20,000, even in all the right areas, is probably throwing money away.

    2. What is typical for my market?

      If your market expects 2 bathrooms, and you only have 1, then its probably wise to add a 2nd from a return on investment perspective. However, in the same neighborhood, its probably foolish to add a 4th. This is true of materials to, if the market expects laminate flooring, don’t expect a large return for marble.

  3. Fixing up a home is romantic - but where is the baby going to sleep?

    Drywall dust is a horrible thing for babies. Take into consideration what your life is going to be like during your dream renovation to ensure it doesn’t become a nightmare. Get a realistic plan and budget before you embark on the journey and then be prepared for adjustments. A contractor can help a great deal to tell you how much your dream project will cost - but an appraiser can tell you how much that dream will be worth, so it doesn’t become a nightmare.

  4. “Fixer-uppers” can quickly become “over-improvements.”

    As noted in this Realtor’s opinion of the market area of Waco Texas, these big beautiful homes that Chip and Joanne build have a hard time being sold for what they cost to build.

    https://www.yahoo.com/lifestyle/waco-realtor-reveals-big-problem-194513387.html

    Builders don’t make markets, buyers do. If there is no one willing to buy a home in a market for more than $250,000, then it doesn’t matter if you put $2,000,000 into it - the ceiling is $250,000. Barring a cash buyer with no knowledge of the area, you’re going to be eating crow and Ramen Noodles for a while.

  5. The Shotgun House

    This episode is so jam packed full of very bizarre real estate decisions/statements, that we need to comment. Lets walk down the list:

    1. They find a home that they are given… that doesn’t usually happen. Further, they are offered reclaimed materials for free… this doesn’t usually happen either.

    2. They move the home to a lot they’ve already purchased. This will make anything but a cash deal nearly impossible.

    3. The home they are given is 1 of 2 left in the city. In a city with a population of approximately 130,000, to have 1 of 2 of something is either very good, or very bad, and in the case of this one bed room home, its not looking good. In home valuation language this home “does not conform to the market” which would exclude it from some financing (even in perfect condition).

    4. At the end of the show they do some funny math, the cost of the lot + the cost of renovation = the value. We’re sure that Chip and Joanna didn’t mean to commit a violation of Texas Appraisal Procedures that could result in a fine, but when they used the word value, they did. Furthermore, this simplistic game of addition, is misleading to the buyer and the viewer. To put it simply, cost does not equal value.

    So what happened then? After a short time the owners, who were told that the house was worth approximately $140,000 attempted to sell it for $950,000, and it sat, and never sold.

    Shocker.

    However, we do want to bring in another interesting point. Zillow claims to have accurate home valuation tools (verbiage that they have been sued over), when you look at the numbers, you see is really more a shell game. In this case, they were consistent with that strategy. A look at the Zestimate history above reveals that Zillow grossly over estimated the land value by 250%. Then when the county assessed the home at approximately the cost of the purchase plus improvements, it simply mirrored the assessment (assessments are not appraisals, and are not good indicators of market value, but they have more credibility than Zillow). Then, when the house was listed for $950,000, the Zestimate shot up to $750,000, before retreating slowly over a year to a level 5-8% higher than before the listing.

    That is how Zillow claims “accuracy.” Their algorithm weights listings heavily assuming that agents have properly informed sellers, and then if the sale closes near that price, Zillow can claim accuracy. However, if the price is way off base and never closes, Zillow moves back to their old math and no comparison of accuracy can be made. So their data on their accuracy is incredibly skewed to act as if they are credible, when in fact, they are just piggy backing on agent’s accuracy (which is FAR better than Zillow).

A few closing thoughts:

  1. HGTV can give you some neat ideas to spruce up your home, but get a professional opinion on the big financial decisions. Builders don’t operate in the world of “value” but rather “cost.”

  2. Neither Chip or Joanna Gaines are licenced appraisers (per TALCB https://www.talcb.texas.gov/), yet they regularly offer the “market value” of the properties both before and after repairs. Per USPAP, this constitutes an appraisal. Per Texas TALCB rules, only an appraiser can perform an appraisal and performing an appraisal without a license can result in a fine of $1,500-$5,000 per time. Over 5 seasons, that brings their total potential liability to the Texas Appraiser Licensing and Certification Board to between $237,000-$790,000.

  3. Never, ever trust Zillow. https://sacramentoappraisalblog.com/2019/05/01/two-things-to-understand-about-zillows-accuracy-rate/

For more on this topic, read below:

https://www.fatherly.com/play/chip-and-joanna-gaines-use-hgtv-to-lie-to-middle-class-homebuyers/

https://birminghamappraisalblog.com/appraisal-tips/an-appraisers-take-on-the-fixer-upper-craze/

https://www.realtor.com/advice/home-improvement/lessons-i-learned-fixing-up-my-outdated-fixer-upper/

Click Here to Explore Blogs by Topic

Header-City-Skyline-Pittsburgh.jpg

The Downsizing Trend: A Path to Wealth.

Downsizing-Homes.gif

As the largest generation in 100 years comes into retirement, they are following the general trend - downsize. However, the younger generations are not following the historic trend of increasing the size of their homes. As supply rises and demand falls, there can only be one outcome, price declines.

“Big houses are a waste. People are still in a mode of thinking about houses that is kind of 19th century. As we modernize, we don’t need all this space,”
— Nobel Prize-winning economist and Yale University professor Robert Shiller

Big homes have large open to below spaces (heating empty air), larger lots (with more maintenance), exclusive neighborhoods (with HOA fees and regulations), and there appears to be a generation who isn’t interested in any of these things. What was once seen as a status symbol of success is increasingly being seen as a liability that keeps people from doing the things that they want to do.This is consistent with the data that shows that the fastest growing part of the market inventory is the $750,000 range nationwide, and that the market needs 15% more in the $100,000-340,000 range to achieve equilibrium (read here for more information). If this trend continues we expect to see increasing declines in higher end homes over the next 20 years, and there may be evidence that it has already begun in our areas. Indiana County has been experiencing property median price declines for the past 3 years, and, higher quality homes do not appear to be immune. However, the area of Monroeville has seen pockets of increase over the last 3 years, yet higher quality median home prices appear to be declining.

graph.png
monroeville.png
8231671430_e83d55aa51_b.jpg

"The key to wealth building is to live in a home that one can easily afford," Sarah Stanley Fallaw, the director of research for the Affluent Market Institute, wrote in her book "The Next Millionaire Next Door: Enduring Strategies for Building Wealth." Stanley Fallaw studied 600 millionaires and found that most of the them had never purchased a home that cost more than triple the amount of their annual income.

While home ownership is a great possible part of building wealth, the old conventional wisdom that property values only ever go up, has been proven to be broken. THE ONE sure fire way to build wealth is to live well below your means, and that includes where you decide to live.

For more on the topic, read these articles:

Yale economist says large homes are a waste of money.

The growing trend towards downsizing.

A loan is not a right

1767168-Ronald-Wright-Quote-Each-time-history-repeats-itself-the-price.jpg

The United States banking industry is stuck in a cycle:

  1. Lend on very good homes, to very good creditors, for low interest rates

  2. Lend on average homes to average creditors for average interest rates

  3. Lend of bad homes to bad creditors for high interest rates

  4. Watch as the financial system collapses

  5. Rinse and repeat.

Right now we’re somewhere around stage 3, as lenders find fewer and fewer individuals of good and average credit scores with healthy assets to lend on. Unless we change our thinking in this regard, it is our fear that history will eventually repeat itself.

A part of breaking out of this cycle is to understand the idea that a loan is not a right. A right is a moral or legal entitlement to a thing. None of us have the moral or legal entitlement to someone else’s money- that is called theft. Rather, we do have the right to be viewed equally within the process of attempting to obtain a loan (this is why discrimination on the basis of race, religion, etc is illegal). However, it is important to understand that that equality of examination may still result in some not obtaining a loan.

  1. Some will not meet income guidelines

  2. Some will not meet down payment guidelines

  3. Some will not meet asset guidelines - the home will fail to qualify

We might agree that individuals in the greatest country on earth should have the ability to access the dream of owning a home. We might agree that “something” needs to be done. However, reducing the qualification of the above is a direct path to cyclical financial collapse. The issues that keep some from home ownership are far deeper than a few regulations and banking policies. They stretch back 100 years to immigration laws, red lining, the antebellum south’s policies, the great migration, and others. There are very real injustices that have affected generations. Recently, in a House committee meeting a few congress persons suggested that appraisers were to blame for the injustices in the data. This is deeply disturbing. Ryan Lundquist has written an informative article on the topic that we hope you will take time to read:

Click here to read more.

In short, appraisers have a public and fiduciary trust to report the real property conditions and market value of a property - not produce reform one property at a time. This would betray the principles of the entire profession. Loan officers/Underwriters also have a trust to write good loans. Congress too has a trust, to ensure that the playing field is level for all participants and to discipline those who tip the scales. Appraisers have been inaccurately blamed in the past (our lobby in Washington is nonexistent, so we’re an easy scapegoat) but power rests in the hands of many others to produce solutions to these looming issues.

Market Data Analysis: Location Part 2

kiski vs fr 400+ larger.PNG

Today we turn our attention to high value homes and a factor that affects market value. For this we will take a birds eye view of an area. This is a look at two school districts’ sales over the past 10 years at the $400,000+ price range. If you had to draw a line dividing the two school districts, without any other help, where would you draw it?

kiski vs fr 400+.PNG

Zooming in on the southern end of the map we see the density remain in the south west portion, and drastically become more spread out to the east and north.

Using the above school district maps we see that the density of $400,000+ sales over ten years highly corresponds to these maps. In the same way that you might draw a line with a pen on the maps above, for ten years buyers have been drawing the line with the wallets.

But why? Franklin Regional is closer to the metro area and its amenities, but the sharp line indicates that this is not the only story. If we look at homes of $400,000+ in the Kiski School District over that same time (32 vs. the 305 in Franklin Regional), we see a median sale price of $442,500 (vs $553,827 in Franklin Regional) and a median acreage of 8.73 acres (vs 1.55 acres in Franklin Regional).

Buyers and sellers are sending a clear message - these two markets are not comparable. If you ever represent a property on the border of a school district, before you assume that you can use sales from across the border, make sure that the market data supports that assumption.

For more on this: https://www.housingwire.com/articles/49830-half-of-homebuyers-with-kids-base-purchase-on-school-district?fbclid=IwAR33nnrqBUS-MEkKBiP8nq6lvwiEnb1RGQbyHcLwjkLZKOzQm0jdfZhe-sc

2019: 2nd Third Analysis

Why a third and not a quarter? Many of the markets that we cover in this report have limited data, which makes analysis difficult, yet we wanted to be able to provide some level of seasonal analysis. Quarter’s would be ideal, however, by extending t…

Why a third and not a quarter? Many of the markets that we cover in this report have limited data, which makes analysis difficult, yet we wanted to be able to provide some level of seasonal analysis. Quarter’s would be ideal, however, by extending the data to four months instead of three we gain 33% more data, and therefore more able to make reliable statements. It's odd, we know, but hopefully you find it helpful.

Before we dive into our regional analysis, we want to take a look for a moment at the national trends. While Western PA proved rather resilient to the last housing bubble (because there wasn’t a high degree of speculation, to begin with) these trends can have wide-reaching effects.

This shows the trend of the median sale price increase (orange) compared to the median increase in building costs since 1990. The past 6 quarters have shown a weakening in the housing market, and some declines. It remains to be seen whether this wil…

This shows the trend of the median sale price increase (orange) compared to the median increase in building costs since 1990. The past 6 quarters have shown a weakening in the housing market, and some declines. It remains to be seen whether this will be a short-lived flattening of returns (similar to the early 1990s, and displayed by the extrapolated green line above) or a pullback towards builder cost trends similar to 2008 (extrapolated by the red line above).

This is the trend line of the entire West Penn Multi List since 2006 (sadly the data available gets increasingly unreliable further back in time) compared to national builder trends. We see a similar divergence in the local data from the trend that …

This is the trend line of the entire West Penn Multi List since 2006 (sadly the data available gets increasingly unreliable further back in time) compared to national builder trends. We see a similar divergence in the local data from the trend that is seen in the national data, and a similar pullback in 2008. The good news: if the national trend remains flat, our local market will likely see little impact. If the national trend moves downward, like in 2008, our declines will likely be far shorter and less deep (again, because prices have not been inflated by speculation).

As the chart above shows, our real estate market is highly seasonal, with fall and winter prices falling and spring-summer months increasing. Last third, this stayed true with increasing prices, but a year over year (YOY) decline. This third showed most markets reversing the YOY trend to increase this year, and mix of trends over the term.

Allegheny East - with 1693 sales, showed signs of increased absorption, declining days on market, YOY increase in the median sale price, and an increasing price over the past four months, all consistent with a strong seller's market and increasing h…

Allegheny East - with 1693 sales, showed signs of increased absorption, declining days on market, YOY increase in the median sale price, and an increasing price over the past four months, all consistent with a strong seller's market and increasing home values. This is consistent with the first four months of the year (with the exception that that term showed housing prices decline YOY). The only concerning data point here is an expired listing ratio of above 25%. This could indicate that over 25% of the market is currently so overpriced as to never consummate a sale.

Allegheny North - with 1761 sales, showed signs of increased absorption, declining days on market, YOY increase in median sale price. However, over the four-month term, the median price of homes fell. Yet, the absorption rate remains firmly within the seller’s market territory.

Allegheny West/North West - with 892 sales, these regions showed signs of increased absorption, declining days on market, YOY increase in median sale price. However, over the four-month term, the median price of homes fell. This market had shown the highest median sale price increase for the first 4 months of the year by nearly 200%. This fall may be a reaction to an over appreciation in the first four months of the year. This market had the strongest absorption rate for the term of the 8 areas studied.

Allegheny South - with 1679 sales, showed signs of increased absorption, YOY increase in the median sale price, and an increasing price over the past four months. However, the market did see increasing days on market and very weak growth of .002% for the term. Still, the absorption rate falls firmly within the seller’s market territory.

Armstrong - only experienced 157 sales over the last 4 months, consistent with last year, but limiting the accuracy with which statements can be made. Over the term, YOY market price and days on market fell. However, over the term market prices rose and absorption rates stayed in the seller’s market territory. However, with over 30% of listings expiring, this is indicative that nearly one-third of the market is so overpriced as to never attract offers.

Butler - with 974 sales, showed signs of increased absorption and declining days on market. However, home prices year over year (+.002%) and over the 4-month term (+.009%) remained nearly flat. Still, absorption rates remain in the seller’s market territory.

Indiana - only experienced 192 sales over the last 4 months, consistent with last year, but limiting the accuracy with which statements can be made. For the last 8 months, Indiana county has shown an increase in median sale prices. Could this finally be the bottom for this market that has been hammered for the past 4 years? With an expired ratio of nearly 35% for the term, there are still a large number of homes that are dramatically overpriced, however, the absorption rate is far increased (from .096 to .184) and is out of buyer’s market territory and moving nearer to seller’s market territory. If Indiana can manage a strong Fall, we may be seeing the bottom.

Westmoreland - with 1442 sales, showed signs of increased absorption, declining days on market, YOY increase in the median sale price, and an increasing price over the past four months, all consistent with a strong seller's market and increasing home values. This is consistent with the first four months of the year (with the exception that that term showed housing prices decline YOY). The only concerning data point here is an expired listing ratio of 25%. This could indicate that 25% of the market is currently so overpriced as to never consummate a sale.

Blue: 30 day moving average (line) with linear regression line (dotted) Orange: 2 order polynomial regression of median days on market

Blue: 30 day moving average (line) with linear regression line (dotted)
Orange: 2 order polynomial regression of median days on market

Blue: 30 day moving average (line) with linear regression line (dotted) Orange: 2 order polynomial regression of median days on market

Blue: 30 day moving average (line) with linear regression line (dotted)
Orange: 2 order polynomial regression of median days on market

Blue: 30 day moving average (line) with linear regression line (dotted) Orange: 2 order polynomial regression of median days on market

Blue: 30 day moving average (line) with linear regression line (dotted)
Orange: 2 order polynomial regression of median days on market

Blue: 30 day moving average (line) with linear regression line (dotted) Orange: 2 order polynomial regression of median days on market

Blue: 30 day moving average (line) with linear regression line (dotted)
Orange: 2 order polynomial regression of median days on market

Blue: 30 day moving average (line) with linear regression line (dotted) Orange: 2 order polynomial regression of median days on market

Blue: 30 day moving average (line) with linear regression line (dotted)
Orange: 2 order polynomial regression of median days on market

Blue: 30 day moving average (line) with linear regression line (dotted) Orange: 2 order polynomial regression of median days on market

Blue: 30 day moving average (line) with linear regression line (dotted)
Orange: 2 order polynomial regression of median days on market

Blue: 30 day moving average (line) with linear regression line (dotted) Orange: 2 order polynomial regression of median days on market

Blue: 30 day moving average (line) with linear regression line (dotted)
Orange: 2 order polynomial regression of median days on market

Blue: 30 day moving average (line) with linear regression line (dotted) Orange: 2 order polynomial regression of median days on market

Blue: 30 day moving average (line) with linear regression line (dotted)
Orange: 2 order polynomial regression of median days on market

What analysis do you want to see included in future? Leave a comment below.

Single wide, double wide, manufactured... Oh my!

Double-wide-home-in-Michigan.jpg

You find your dream ranch styled home, obtain financing, make an offer, and then the appraisal comes back saying the home is a double wide?! How did no one say anything! We’ve seen this scenario where a deal is progressing and then the bank pulls back because they will not lend on a “manufactured home.” In some situations, they can be hard to spot, but it can mean the difference between being able to purchase a home or not. So today we want to equip you with some tools for the field on how to spot a manufactured home, and what issues may need to be overcome.

First lets clear up some terminology:

  1. Manufactured Home - refers to a home that is constructed to meet HUD guidelines, built off site, delivered to the property in portions and then connected. “Single-wides” and “Double-wides” and “Triple-wides” are manufactured homes.

  2. Modular Home - refers to a home that is constructed to meet building code and it is also built off site and delivered to the property in portions and then connected.

The real difference is the quality of the craftsmanship and the minimum requirements of construction. Manufactured homes are built to HUD standards and modular homes are built to IBC (International Building Code) standards.

Here are a few easy steps to determine if the property is a manufactured home:

  1. Order the county record. Most counties will note if the structure is a manufactured home and in some cases regardless of how many sections, call it a trailer.

  2. Look for the HUD Tag located on the corners of the home

  3. Look for the HUD data plate or certification, which is a piece of paper glued to some surface of the home (under the kitchen sink, in a closet and near the electrical panel are most common)

  4. Look at the bottom of the structure. If you see a steal under carriage this is a sure sign (but some manufactured homes have wood under carriages) then this is a manufactured home not a modular.

Why is this important:

  1. Manufactured homes built prior to June 30, 1976 can not obtain typical financing. This makes finding the HUD Tag and Data Plate very important. We’ve recently seen a manufactured home built in 1970 sell with conventional financing in the MLS - sadly this person (and the appraiser who signed off on it) will be in for a rude awakening when they attempt to sell.

  2. Manufactured homes have a very different marketability than modular or other stick built construction. This is represented in the fact that FNMA requires these to be performed on a different forms with different analysis.

  3. Remember, once a manufactured home, always a manufactured home- no matter the modifications. We’ve run across manufactured homes with extensive additions and/or remodeling rendering them very similar to a typical stick built structure. However, for lending purposes, it will always be treated as if it is a manufactured home, no matter the modifications.

Some common questions:

  1. What if my home sits on a permanent foundation and/or was recently converted to real estate?
    Once a manufactured home, always a manufactured home. That’s the answer, basically. Converting your home to ‘real estate’, or placing your manufactured home on a concrete block foundation, for instance, will not change the fact that it is manufactured. It will still be appraised the same way and will have the same marketability as before.

    • But what if I changed/updated/upgraded almost everything?

      If any part of the original manufactured home remains, FNMA requires that the property be analyzed as a manufactured home.

    • But it doesn’t even look like one anymore?!

      See above.

  2. My manufactured home has vinyl skirting. Will it qualify for FHA financing?
    Not without backing. FHA states that “if the perimeter enclosure is non-load bearing skirting comprised of lightweight material, there must be adequate backing (such as: concrete, masonry, or treated wood) to permanently attach and support or reinforce the skirting” This means that your vinyl skirting will need to be reinforced with backing. It’s been our experience that treated wood is the cheapest and quickest fix.

  3. I can’t find my HUD Data Plate / Compliance Certificate in my house. Is that going to be a problem when I sell? It depends. Don’t you love that answer? It really comes down to the lender. When needed, your lender will be able to guide you through this process. But to get you started, you can check out this helpful link by HUD: https://www.hud.gov/program_offices/housing/rmra/mhs/mhslabels

Whether you’re buying or selling, knowing the difference between a manufactured and modular home could mean the difference between making and breaking the sale. Make sure you advertise your home for sale correctly and make sure if you are a buyer that you do your homework to make sure the home is what the seller says it is.

Market Data Analysis: Odd Properties

iStock-691963380.jpg

Odd balls: Geodesic domes, underground dwellings, and those homes that make you ask, “Why?” These are atypical for our market area, but they exist and they sell, so there is supply and demand and therefore a market. If there is a real estate market, then there is a market area. In the past 10 years there have been 11 sales of geodesic domes in the entire West Penn Multi List. So if someone wants a home of this style, where are they willing to consider - in other words, what are the boundaries of the market? An entire region. The more unique a property the wider the market boundaries and the need to expand.

For a less extreme look, lets consider log homes. These are not typical for the market, but certainly more common than domes. In the past 3 years there have been 11 log homes sold in Armstrong County. If a buyer is committed to this style of home, where will they consider? Given the relatively low supply, they would like consider the whole county. They might also consider looking in neighboring counties as well. They might also consider constructing their own. So, with such low supply why aren’t there log cabin sales people on every corner? Due to the equally low demand. Low supply and Low demand = stable markets.

Take away:

  1. When a property is typical for a market, your market area can be as small as a single street.

  2. However, when the property is unusual, the market area will expand quickly. Imagine for a moment being asked to sell 1600 Pennsylvania Ave NW, Washington, DC 20500. The White House. How would you determine a fair price? What would your comparables be? Aside from “priceless,” if we had to place a dollar amount, our comparable search would be global in scope, including historic homes from various countries and cultures.

When pricing a property consider the buyer motivations at work. Get in the head of the buyer pool and ask the questions they’re asking. Its the tough assignments that make you grow.

Property Inspection Waivers: Who is going to be sued?

getty-lawsuit.jpg

Fannie Mae is attempting to speed up the closing process by removing measures to ensure that properties have enough value to cover their loans… what could possibly go wrong?!

In markets where regularly see Original List to Sale Price ratios of 120%+, without an appraisal, its very possible that borrowers will be underwater once they close of there isn’t an independent, third party examining the property to determine market value. And if this is the case, who will the borrower come after when they find out 6 months later that they’re underwater?

Fannie Mae - has the backing of the government and enough money to pay for lawyers.

The bank - has no legal requirement other than the FNMA requirement.

Who is the only party in the transaction who is legally required to act and advise the best interest of the borrower? Who is the softest target to get the difference of sales price and market value from? The answer is the same: the buyer’s agent.

Appraisers nationwide realize that in years to come PIW will be a source of legal fallout, and are preparing to do retrospective valuations of properties for borrowers who were injured by the negligence of this FNMA policy. Don’t put yourself in a position that could cost you tens of thousands of dollars in years to come to speed up the closing by a few days now. ALWAYS advocate for client’s interest to know the market value of their home by an independent third party.

Hypothetical houses and hypothetical markets

maxresdefault.jpg

Appraisers evaluate hypothetical houses every day - let me explain. Here are some of the examples:

  1. New construction - we appraise what the home will be worth upon completion as if it was built at the time we write our report, using the data that is given to us. Without this valuable tool, banks wouldn’t be able to make informed investment decisions and homeowners would be left at the mercy of overpriced builders.

  2. Exterior-only appraisals - everyday appraisers are on the streets inspecting properties from the street, or “Drive-bys” as their called for short. These are most often used by lenders considering foreclosure. They want to know if their asset is still in good shape and worth enough to cover the remaining loan. In this instance, the appraiser assumes that the interior of the home is in similar condition/quality to the exterior. We then use public records, prior multi-list data, and other sources to determine the value of the hypothetical house that all of that information tells us.

  3. Regular appraisals - even when the appraiser has all the facts, and inspects the property themselves, there are things that the appraiser has to assume. We assume that the couch in the living room or the bedroom dresser isn’t hiding a gaping hole - we never move the furniture to check. We assume that what we see is consistent with what we can’t see.

All of these have their place, and are needed - but they also have a risk. An appraiser is always evaluating some degree of a “Hypothetical House,” the house that they can see, and assuming the rest. What if the assumption is wrong? Of the above, the most likely to be incorrect as to the real value of the “Real Home” is the drive by - the more assumptions that have to be employed, the more potential error is inserted into the system.

Appraisers play a part in the overall health of the real estate system.

  1. Real estate agents - help to inform and educate buyers and sellers

  2. Loan officers - help to ensure that the borrower is fit to secure a loan

  3. Home inspectors - help to ensure that the property is safe and secure

  4. Appraisers - help to ensure that the dwelling is fit to lien for the loan

Take any cog out of this machine, and the overall health suffers. But that is exactly what we see beginning to happen, and all in the name of making more money, faster.

The current trend is towards appraisers not inspecting the property at all. They are being given a report prepared by another party, without any necessary education on how to inspect a house. Appraisers are then expected to make value determinations based on that information. Can they produce credible results? Only as credible as the inspection, but yes. If this is the move that is coming to the real estate industry, then these inspectors need to be held to high standards. An appraiser trainee must train for a minimum of 300 hours and have 75 hours of education before they can inspect a home on their own, and only with the permission of their mentor. With this new move, a dangerous step is being taken back towards the early 2000’s where appraisers only had to inspect from the street… and this had a direct contribution to the housing collapse of 2008 (along with massive mortgage fraud on the part of the banks pushing for more money, faster… does anyone hear an echo?)

The further appraisals are removed from “Real Houses” and pushed towards valuing “Hypothetical Houses” the further we will move from actual “Real Estate Markets” and further towards “Hypothetical Real Estate Markets.” When these two collide, trillions of dollars go up in smoke in an instant.

listen-1.jpg

Over listing your home will cost you money.

Jumpfly-Pricing.jpg

We see it everyday- a home is listed shooting for the moon, a price that will never see a contract- but who does it hurt? In the case of Indiana County, it’s hurt 50% of sellers.

Lets look at a hypothetical situation to better understand the issue:

  1. A seller sits down with an agent to list their home. During the conversation, a listing price is agreed to that is 20% above the actual market value. This could happen for a few reasons:

    1. The seller has a mortgage that is far above the current market value and they are hopeful to get a sale price that covers the mortgage

    2. The seller has an expectation that is far above market value

    3. Complexity of the property made it difficult for the agent to analyze

    4. Inexperienced agents with a focus on commission rather than educating the seller regarding market trends

    5. In the case of a For Sale By Owner, the seller may lack the experience to price their home

  2. The home is on the market, and buyers begin to search:

    1. Buyers who are in the price range to shop for the subject’s market value + 20%, look at the subject and see that it is far inferior to other properties, and walk away.

    2. Buyers who can afford the subject property at the market value may never look at it, because it is listed outside of their price range.

  3. The home sits on the market. In the case of Indiana County and portions of Armstrong County where these trends have been seen, they sit for a long time. The normal 3 - 6 month marketing time passes and then 9 months and then 10 months. (Crickets)

  4. The seller and agent get serious as the listing contract nears expiration. They begin/continue to drive the list price down. They finally get to the market value.

    1. Buyers who can afford the property finally see it within their search parameters.

    2. Buyers/Agents see the marketing time and price decrease history and assume there is something wrong with the property OR that the seller is desperate

  5. Buyers, holding all the cards in the deal, finally make an offer.

Initially listing the home well above market value, often leads to the home selling below market value. In the case of Indiana County this, among other factors, has resulted in declining home prices in rural market areas.