Murrysville sales prices

Murrysville 2022 Market in Review

The year 2022 was a year of historically low inventory and high demand, unlike anything Murrysville has seen in recent history. Interest rates have been a major player in the market this year and definitely caused some of the historic gains to cool off towards the last quarter of the year. As rates rose, activity slowed- at least to a certain extent. As you look through this report, you will notice that the rise in mortgage rates corresponds to other market data events.

The annual median home sales price rose from $330,000 in 2021 to $374,100 in 2022 which is a 13.4% increase. Compare that to the year 2020 when the median sale price was $300,000 and the increase was at 10%.  In looking to this coming year, it is safe to say that these increases will cool down. To what degree will depend on mortgage interest rates, inflation, demand and market saturation.

The general trend in the median sale price over the past year has been increasing with the peaks in those increases showing up during the summer months.

The supply has been historically very low in 2022 and this chart shows that there was a build up right around April. It is typically between March and April that sellers list their properties in anticipation of the height of the buying season.

The marketing times (expressed in DOM- days on market) has also been extremely low. However, in the past few months, this has been rising due to a cooling in the market most likely attributed to seasonal cyclical events during winter months and compounded by the rising mortgage rates. A rise in marketing times should be viewed as a possible indicator that listing prices are at a peak point and/or demand is starting to balance.

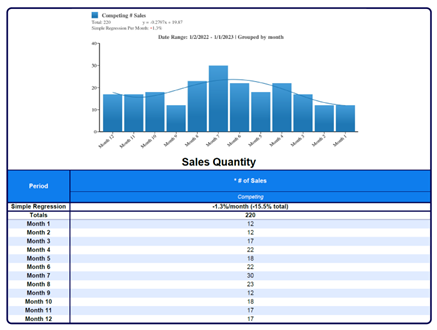
As is expected, the quantity of sales is most active in the months May through September.

The current number of active listings is also decreasing. We will have to wait to see if this starts to increase when the market typically experiences seasonal cyclical events around March or April when sellers like to place their properties on the market.

Not only as demonstrated in the previous chart which showed the number of actives decreasing, the median list price is also decreasing. This could be significant to keep in mind. As the marketing times increase and the list prices decrease, this could have a direct impact on the median sale price going forward. Only time will tell how all of this will affect 2023 sales.


Murrysville Year 2021 in Review

Last year, I relocated my business to Murrysville. It has been a pleasure to provide residential valuation services in an area that has so much to offer. As many have heard, read or experienced, the real estate market in the year 2021 was crazy. Houses would go up for sale and within a very short period of time, sometimes hours, multiple offers were received. Buyers were getting very aggressive with their offers, electing to forego all inspections, include escalation clauses and even include things such as free pizza dinners on Fridays for a year or Super Bowl tickets.

I decided to run the numbers on Murrysville as a whole and found that in the year 2021 there were a total of 267 recorded sales using a search of our local multiple listing service. These numbers do not include foreclosures or short sales. As an appraiser, we analyze what is going on in the market area. When doing this, we have to look at both the long term and short term activity in order to be able to recognize when there are changes happening in the market and how to best determine how this impacts value.

Murrysville Year 2021 Real Estate Sales Statistics

If you look at the general statistics of the area as a whole using simple regression, this shows that the year in review experienced a rising predominant sales price of about 1.3% per month.

Murrysville, 2021 Qtr 1

The moment you break down the sales prices into quarters, there are some very interesting results. The first quarter of the year had 59 sales which was the least number of transactions per quarter but was the only quarter that experienced an increase in predominant sales prices. Seasonally, the first and fourth quarters typically are the times of year with the least number of transactions, however, there were not the significant differences that we would typically find between the quarters. Quarter 2 had 78 sales, quarter 3 had 63 sales and the last quarter had 65 sales. More surprising is that the remaining 3 quarters experienced declines in the predominant sales prices.

Murrysville, 2021 Qtr 2

Murrysville, 2021 Qtr 3

Murrysville, 2021 Qtr 4

It is important to know that when determining the impact of what is going on in the market, statistics need to be analyzed specific to the area and specific to the time frame being impacted. Quarter 1 experienced a very significant increase in sales prices, quarter 2 was basically flat, quarter 3 had a reverse reaction by a notable decline with another decline in the 4th quarter but not as significant as the previous quarter.

The good news is that the declines of the last 2 quarters did not erase the overall trend of an increase from the beginning of the year. However, the last 2 quarters show that there could be a definite trend that is showing a cooling off and decline in the predominant sales prices.